Production
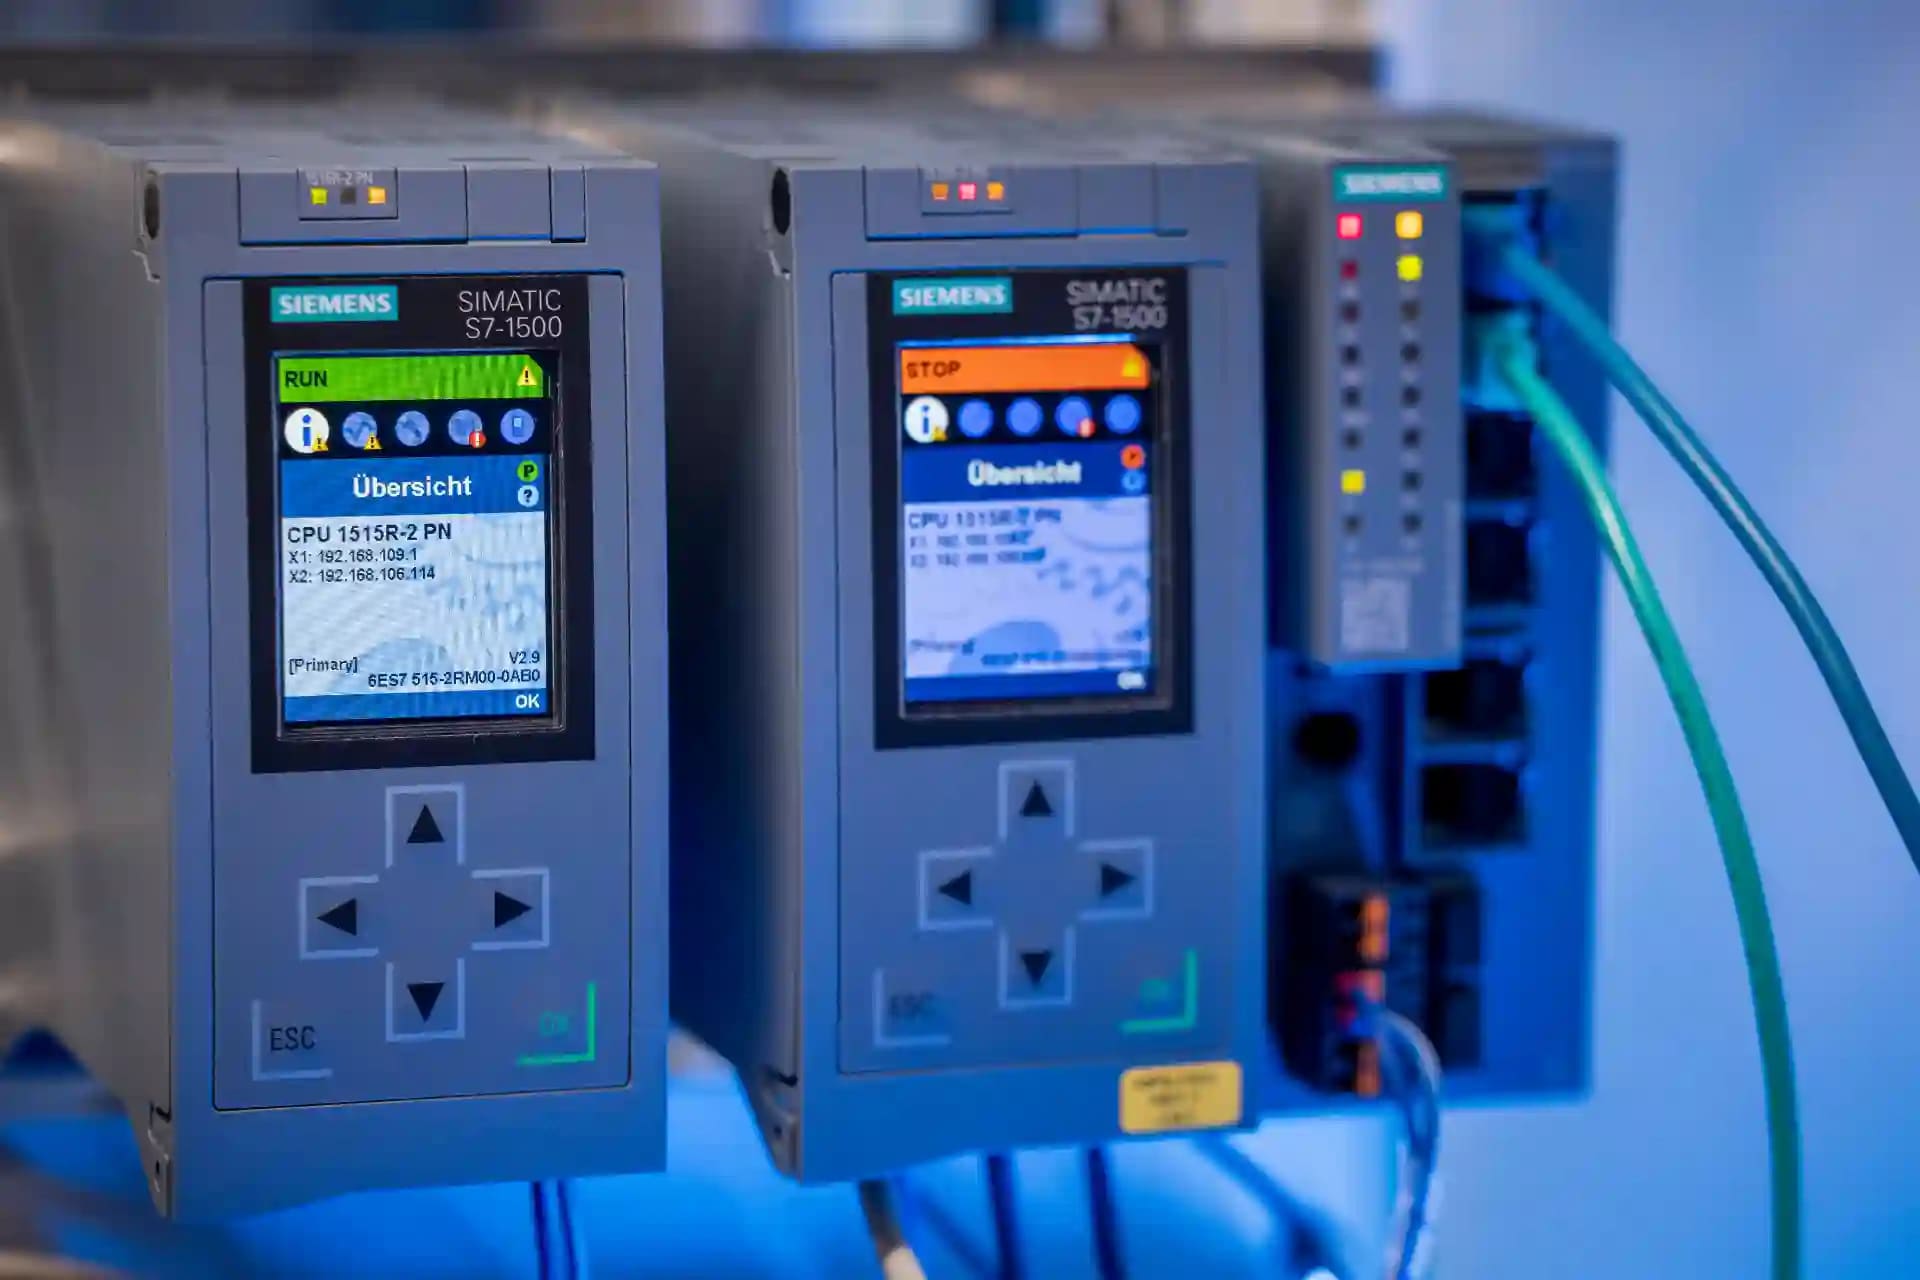
Discover machines and connections in a production line. Identify dependencies during maintenance and outages.
secnostic® sensor inspects endpoints and networks directly, finds assetsAn asset is a physical or digital element that is relevant to operations, control, monitoring, or security. and their connections, and reports what is actually there.
Instead of trusting your lists, secnostic® sensor checks the real ITIT comprises systems, networks, and software that process, store, transmit, or provide information. and OT environmentOT covers hardware and software that monitor and control physical devices, plants, processes, or infrastructure. and fills the gaps nobody maintains by hand.
Spreadsheets go stale the moment someone plugs in or rewires something. secnostic® sensor checks for itself: on Windows and Linux, in Active DirectoryLDAP is a protocol for accessing directory services; Active Directory Domain Services is Microsoft's directory service for network objects, users, computers, and resources., on the network, read-only and gentle in OTOT covers hardware and software that monitor and control physical devices, plants, processes, or infrastructure., plus Microsoft 365, Intune, and Sophos Central. Every finding stays local with its source and confidence level; an optional Fleet Manager combines data from multiple sensors. Passing sensor data to inventory requires a configured integration. So you see what is really there, what changed since the last run, and where a blind spot still remains.
Specialized collectors gather evidence from ITIT comprises systems, networks, and software that process, store, transmit, or provide information., OTOT covers hardware and software that monitor and control physical devices, plants, processes, or infrastructure., identity, and cloudCloud refers to on-demand IT resources such as compute, storage, platforms, or software that are consumed over a network., grouped by how gently each is read. The sensor normalizes and stores every finding locally with its source and confidence level. sensor stores observations locally first and can optionally send them to an accepted parent Fleet. sensor initiates the connection itself. Passing sensor data to inventory requires a configured integration.
Which protocols the sensor reads, how that looks in practice, and the explicitly approved scope active discovery runs in.
An operations team wants to know which devices are active and talking to each other, without touching anything.
An ITIT comprises systems, networks, and software that process, store, transmit, or provide information. team needs a current list of every system and its installed software, without installing anything on each machine.
The same device is often seen more than once. The sensor merges this evidence into one reliable entry.
Active and OTOT covers hardware and software that monitor and control physical devices, plants, processes, or infrastructure. discovery is not a free scan. An explicit, fail-closed scope and a policy per probe decide what is probed at all, gently and read-only.
Dashboard, hosts, graph, connections, and findings stay separate by task and share one observation stream.
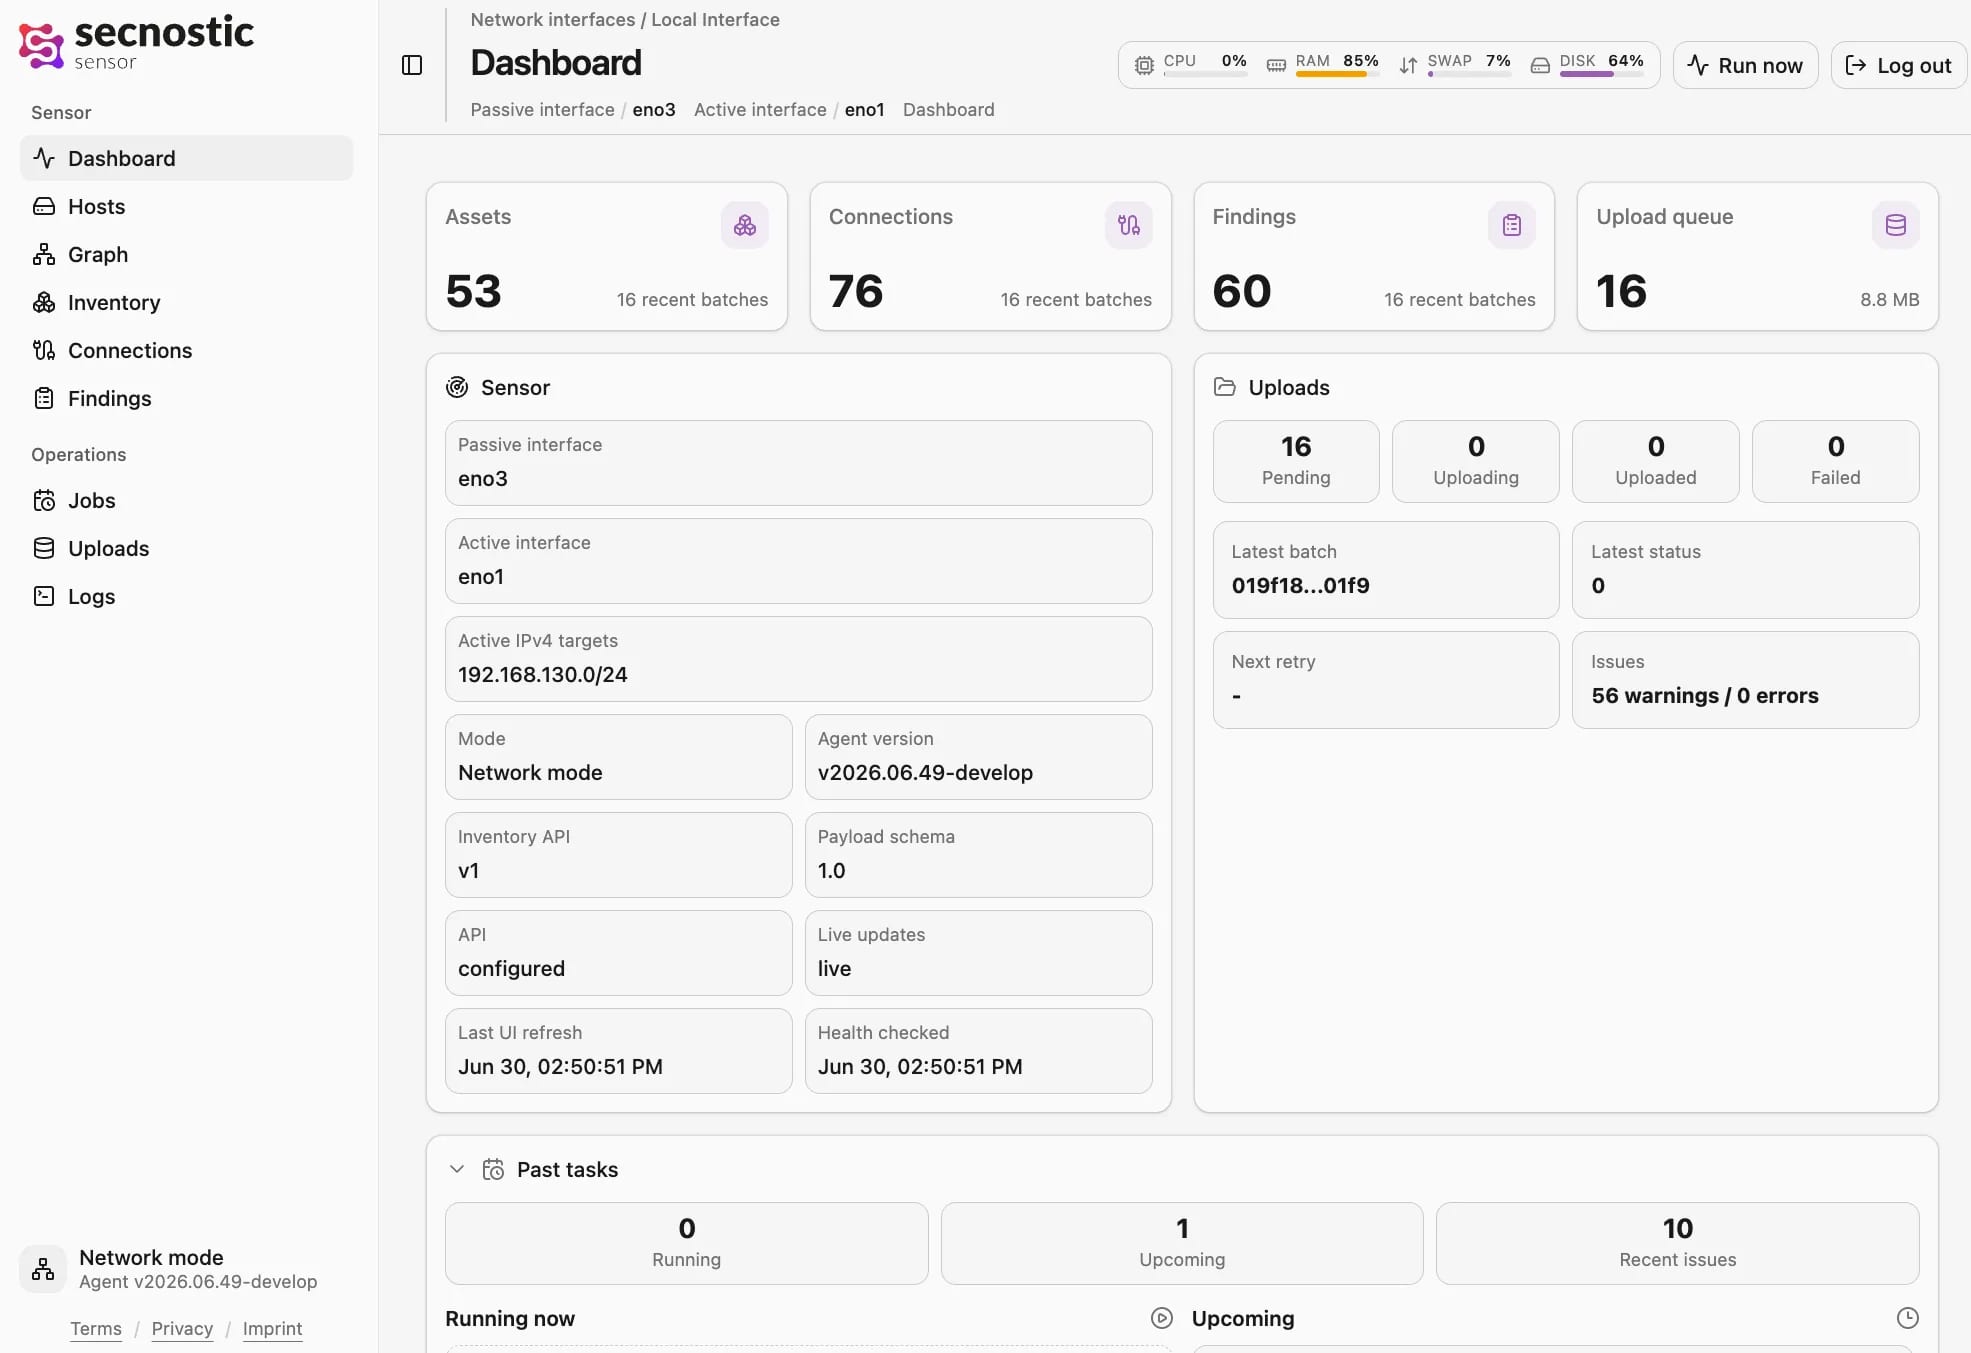
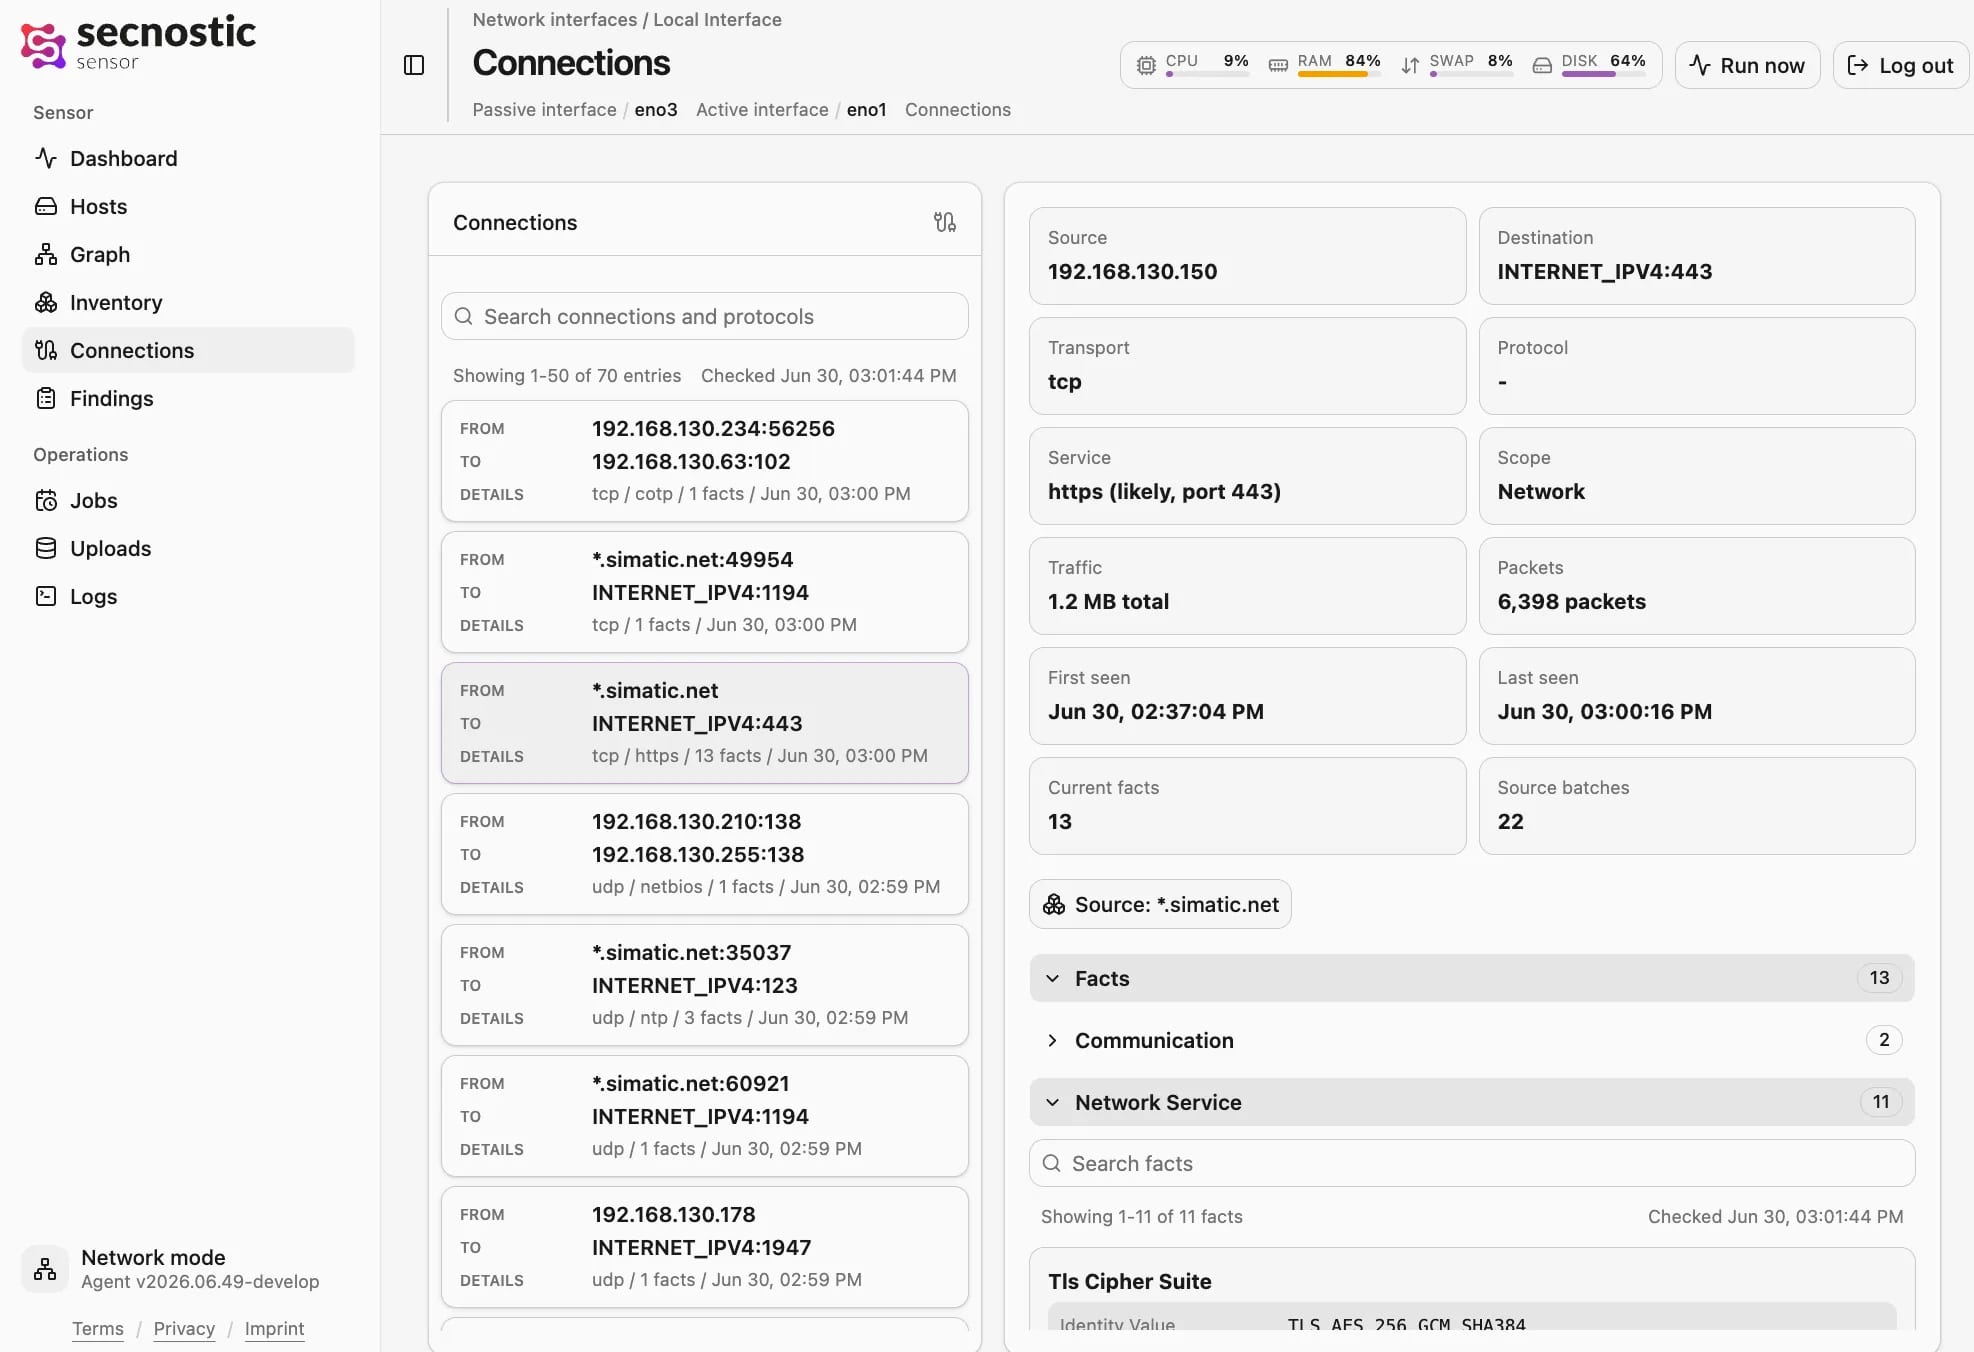
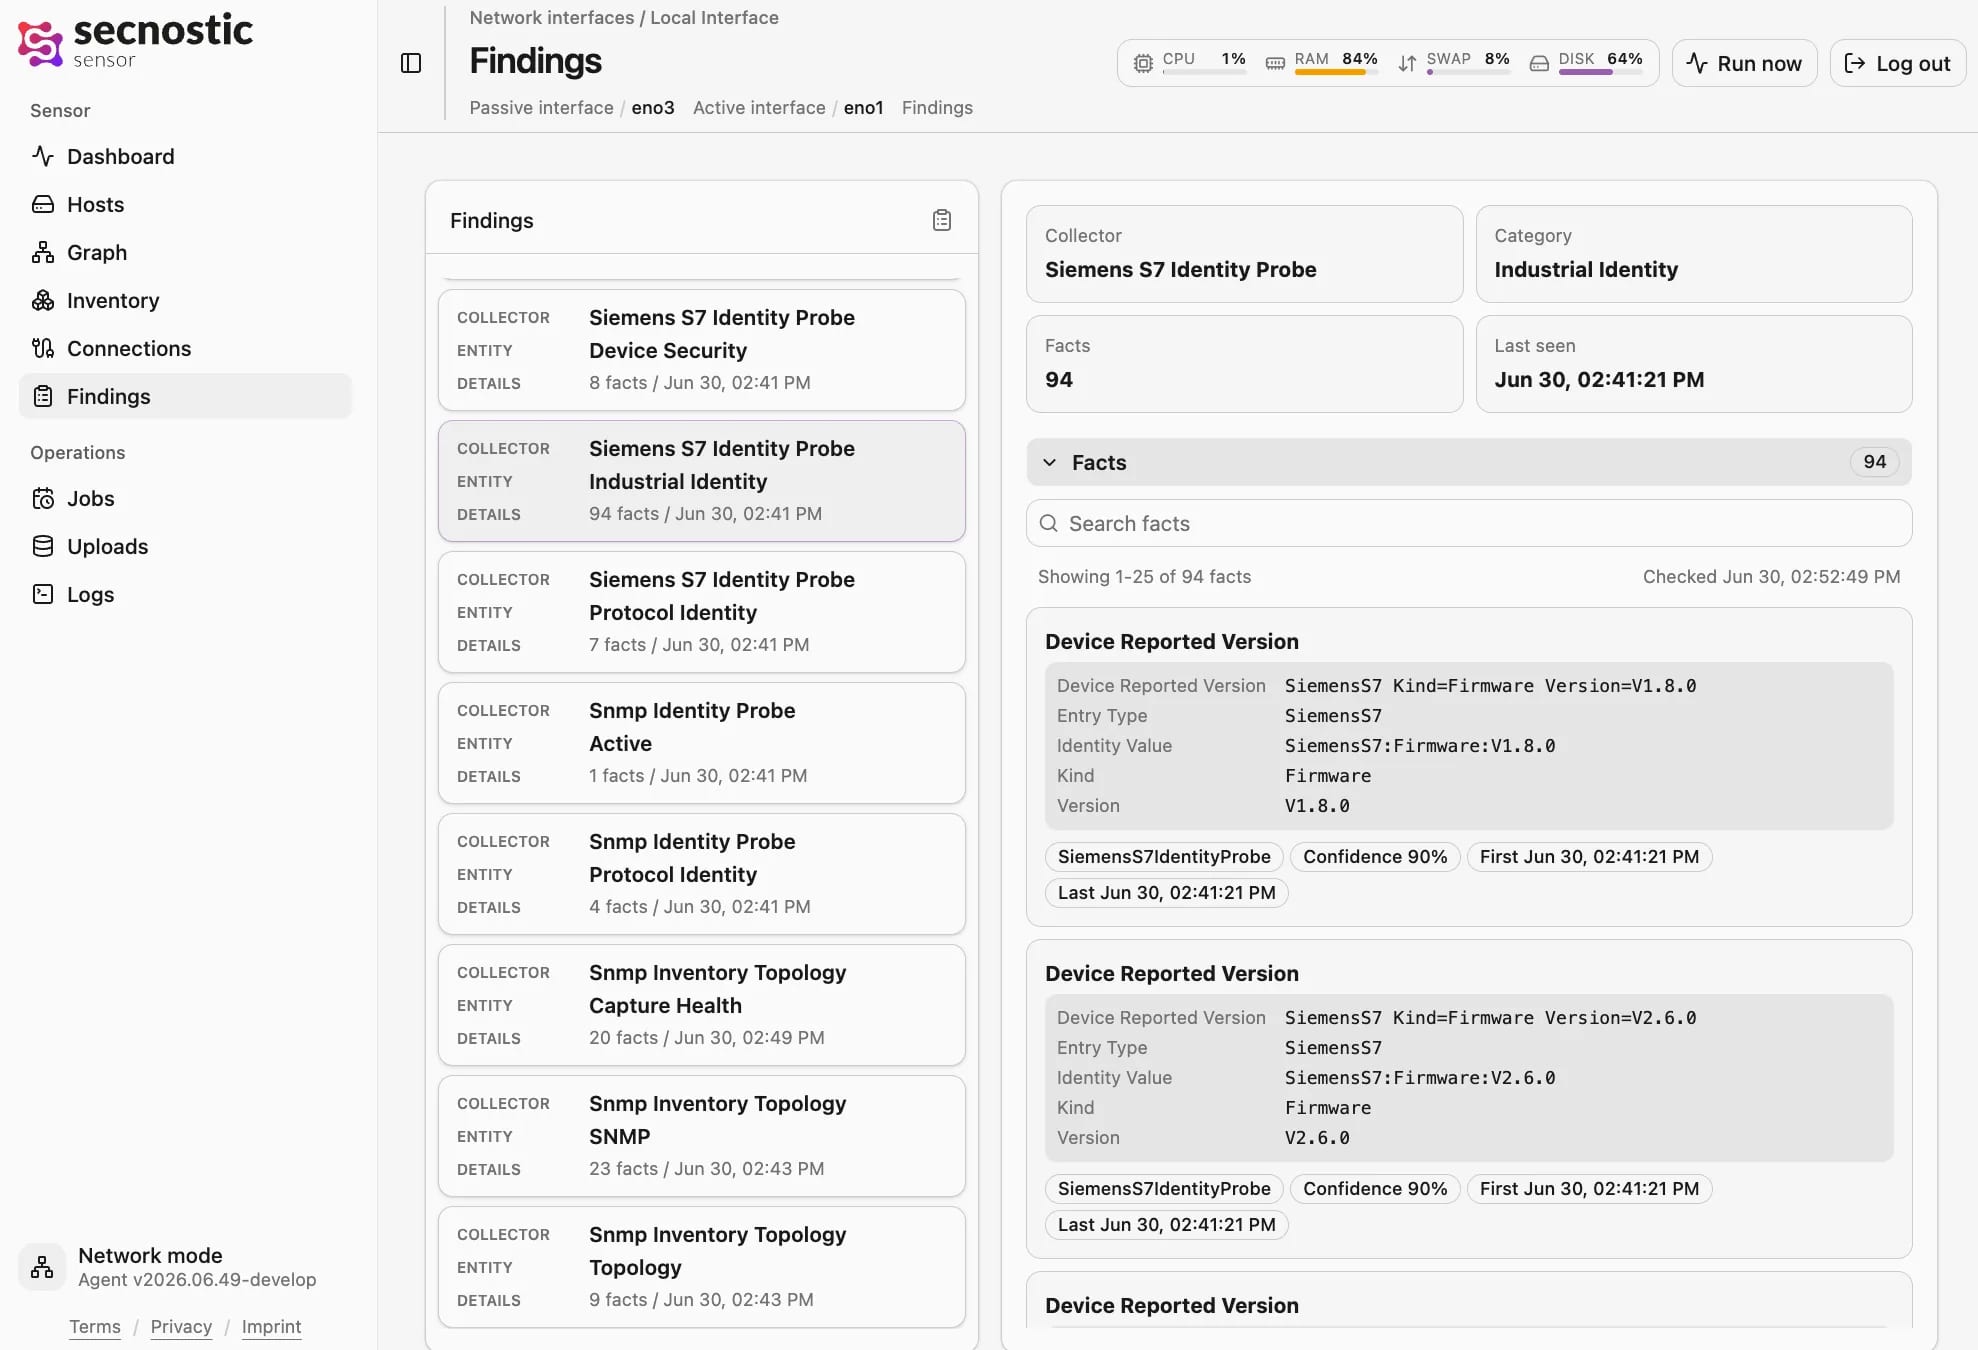
Dashboard: assets, connections, findings, and the upload queue at a glance, with the sensor's identity, version, and health.
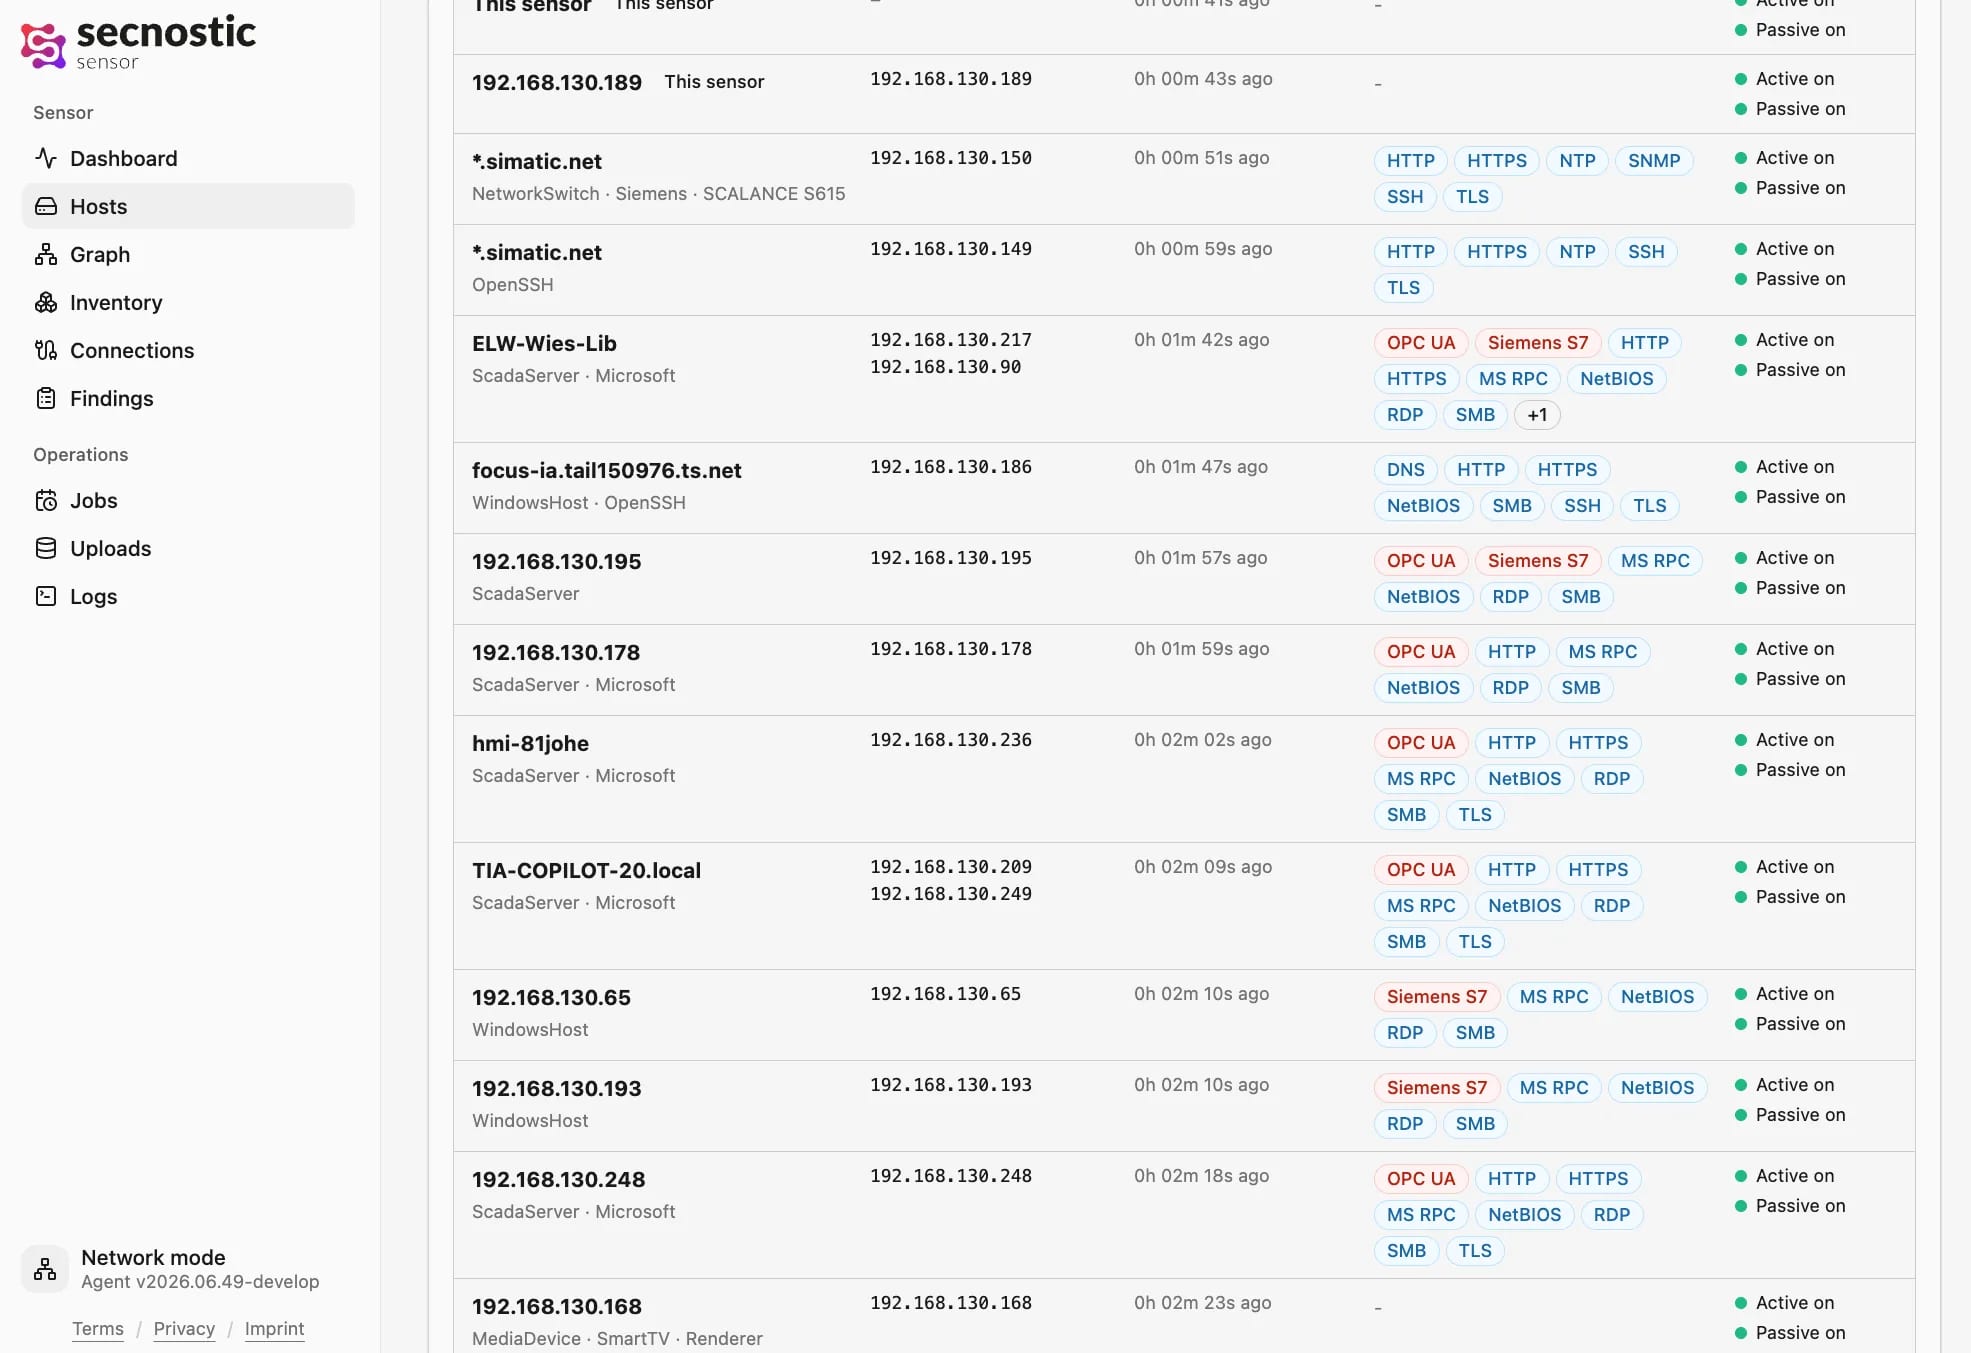
Hosts: every discovered asset with its IP, vendor, protocols, and source, seen actively or passively.
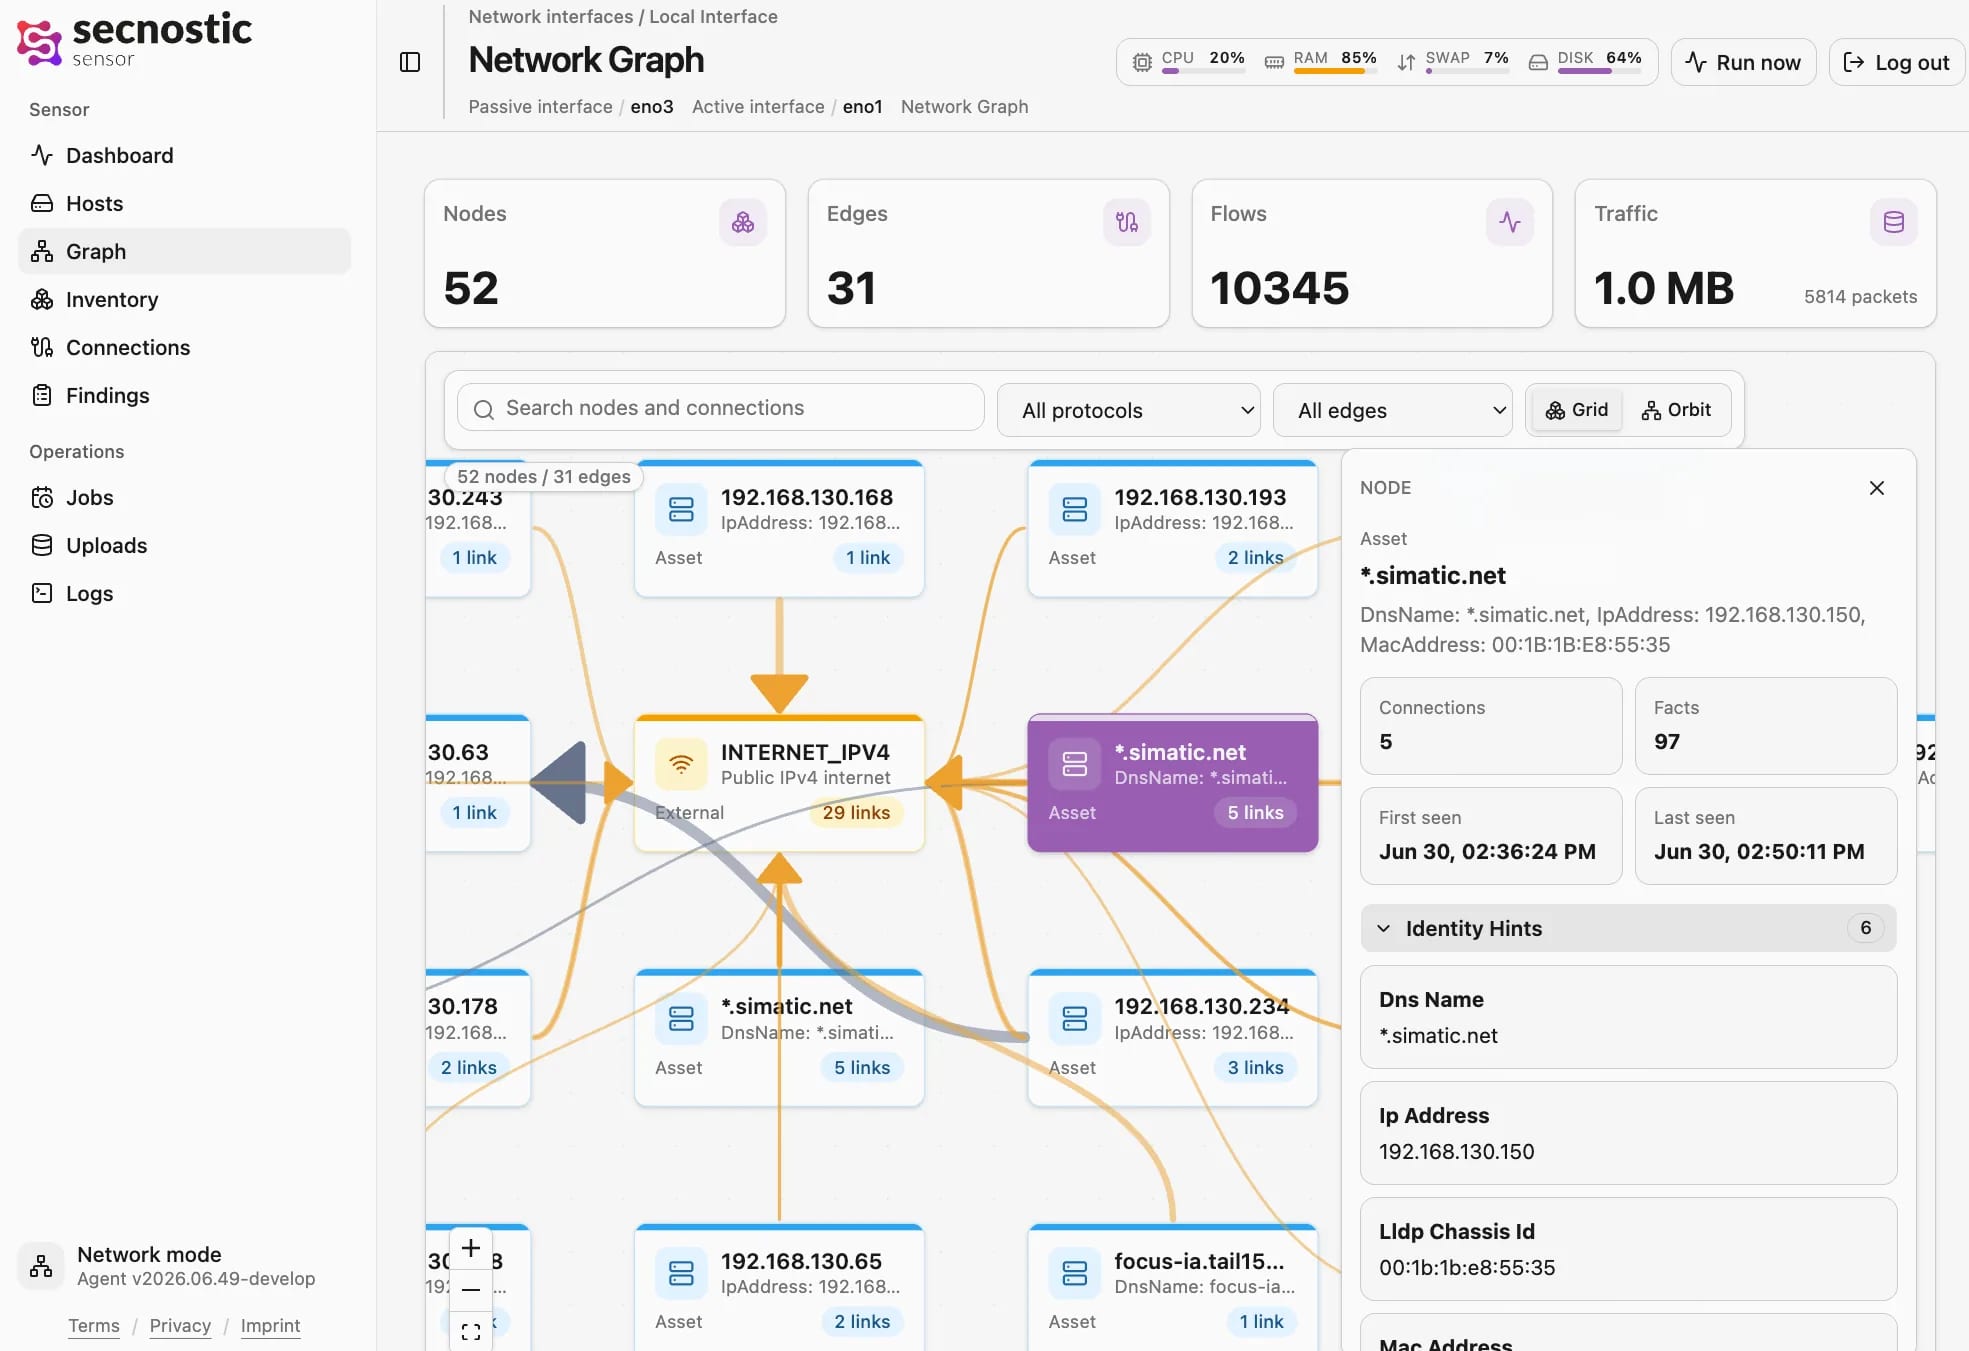
Network graph: who talks to whom, with nodes, edges, traffic, and identity hints per asset.
Connections: every path of communication with endpoints, protocol, volume, and service, as proof instead of a guess.
Findings: detected devices and facts, such as a Siemens S7 identity, with category and reported version.
Discover machines and connections in a production line. Identify dependencies during maintenance and outages.
Bring together facilities, networks, and ownership across sites. Understand dependencies for operations and maintenance.

Discover technical devices in a building and their connections. Assign ownership and remote access.
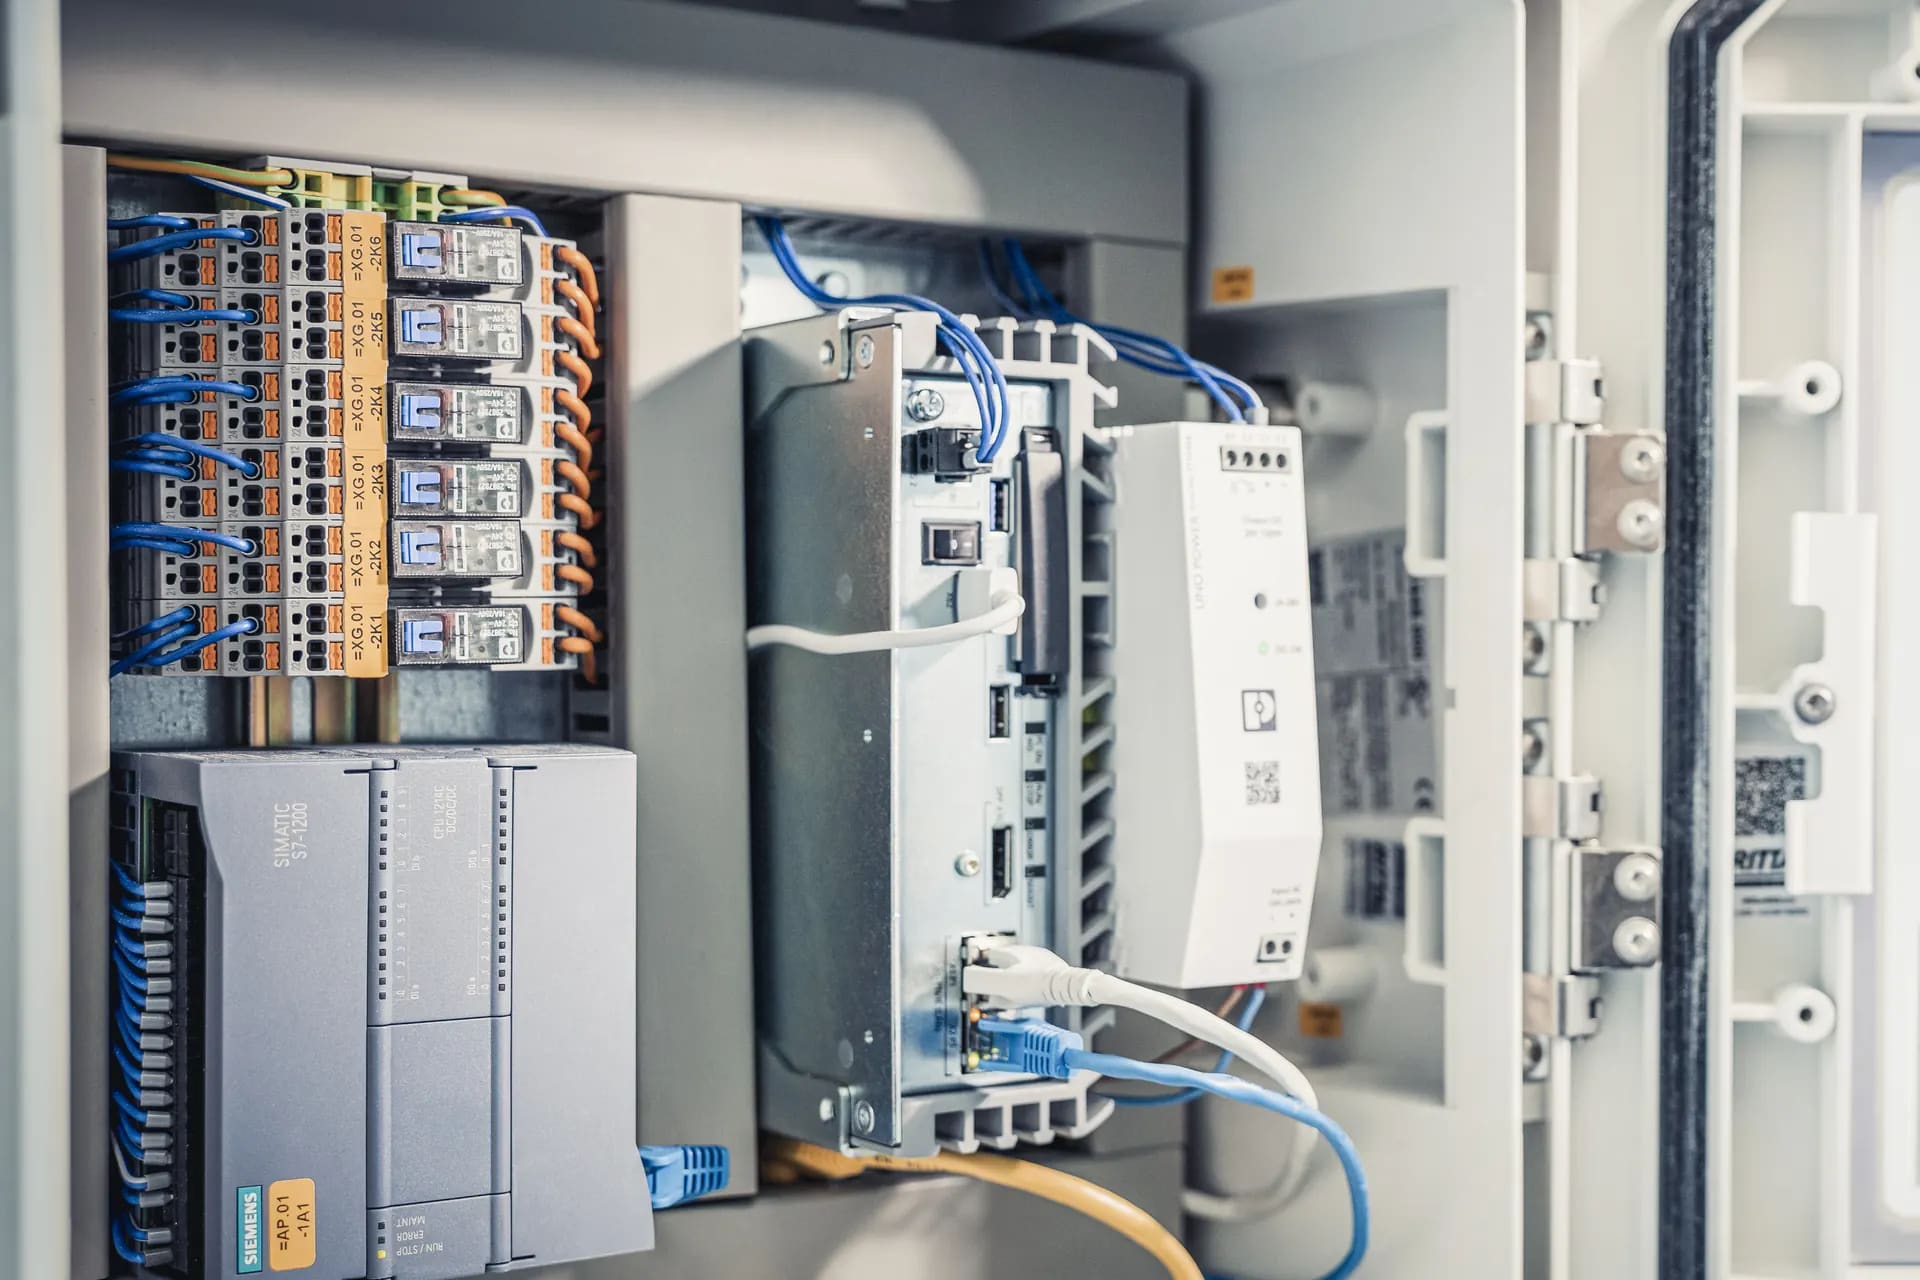
Bring together computers, servers, software, and cloud services. IT operations and support use the same inventory.
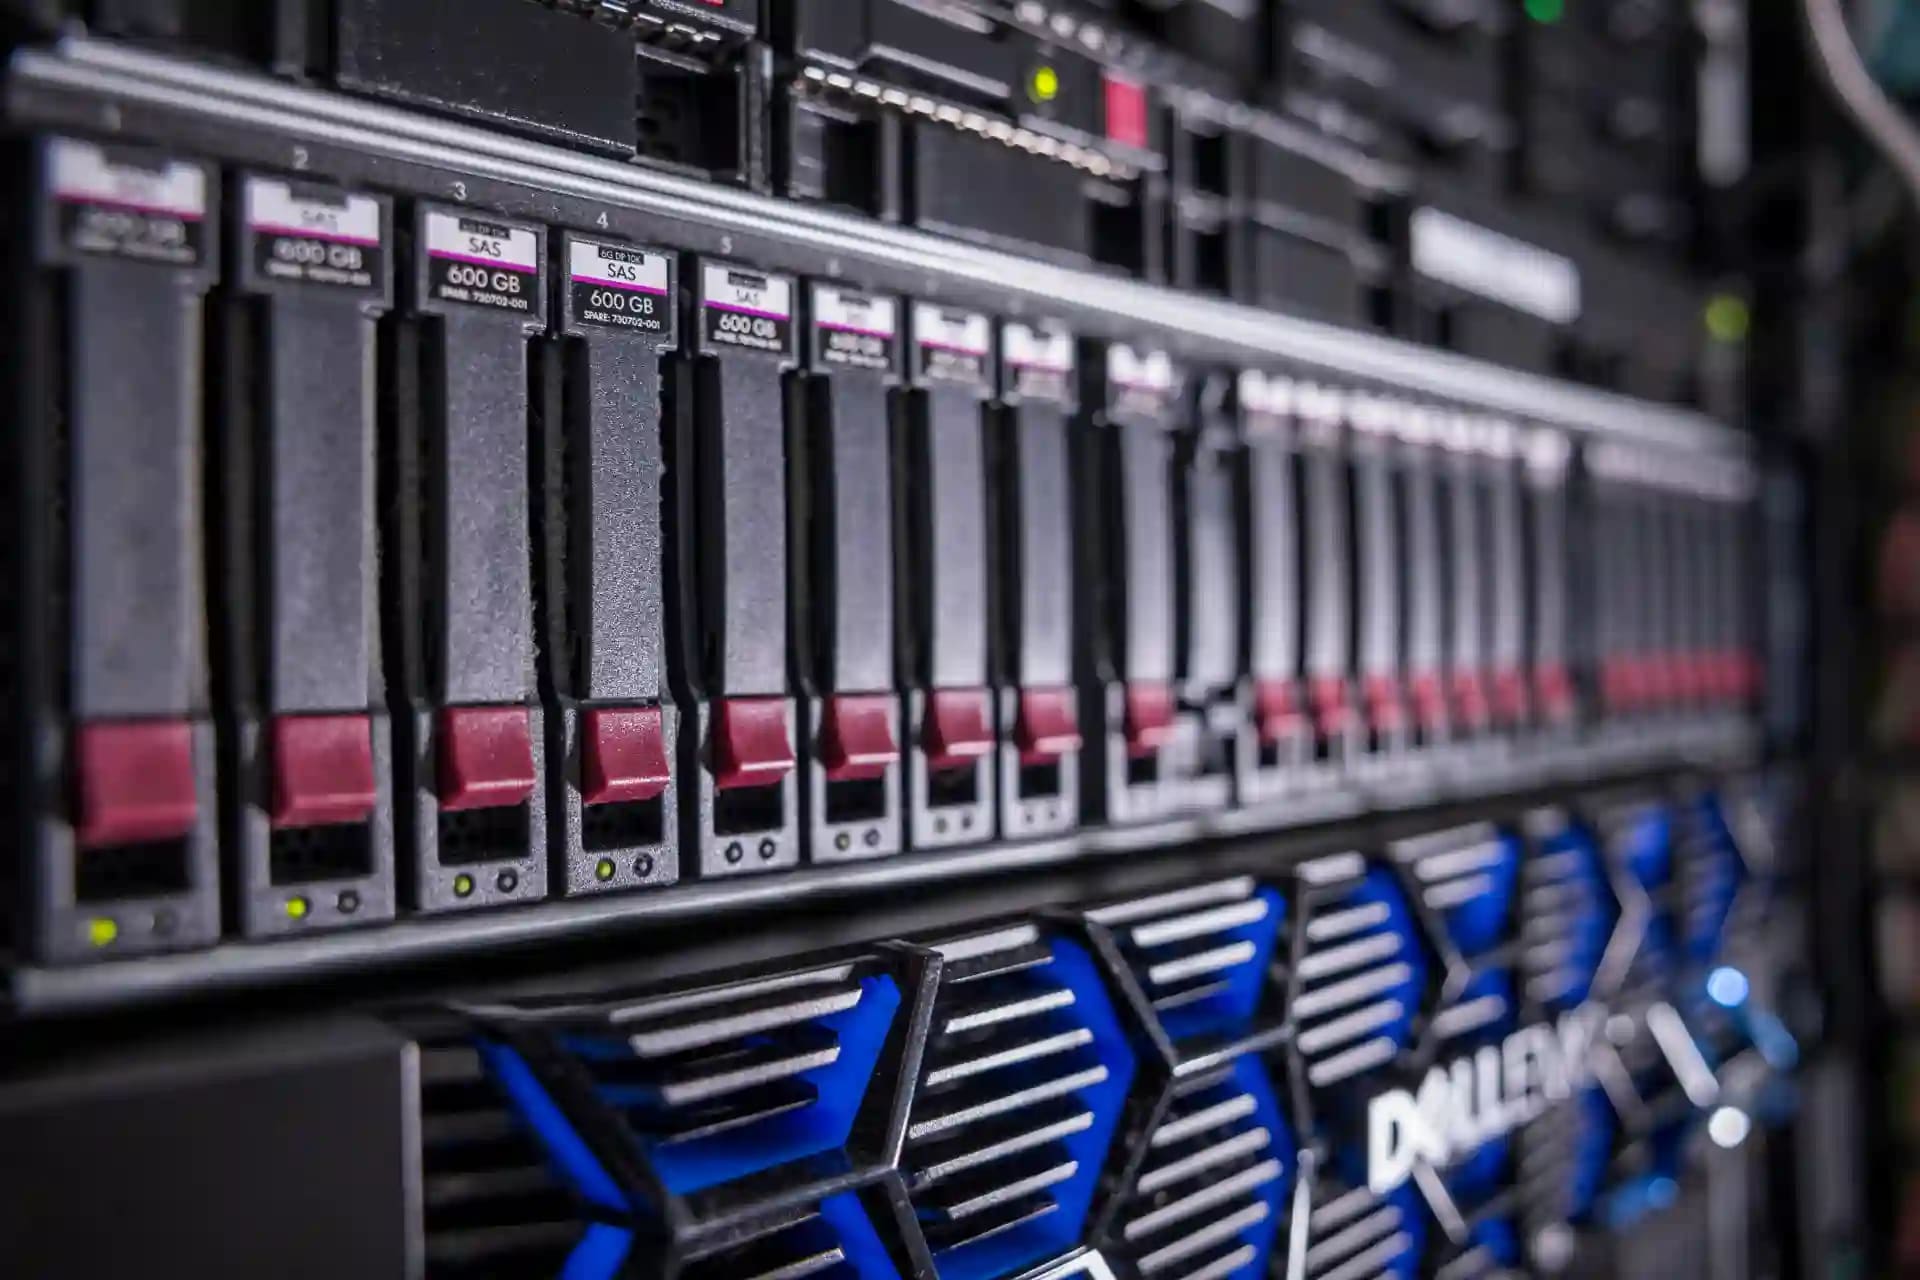
Manage devices, risks, and ownership for each customer. Keep customer environments separate and find information for support.

Document components and software versions in delivered machines. Find changes and affected machines when providing service.
Key questions before a sensor rollout.
sensor can collect certificate information from approved TLS queries and suitable network data, such as the issuer and fingerprint. The available information depends on the collection method. The mTLS connection to Fleet authenticates the transport peers; it certifies neither an observed device nor the product.
No. The sensor is a pure collection probe. Passive network visibility sends no packet, and every active or OTOT covers hardware and software that monitor and control physical devices, plants, processes, or infrastructure. probe only reads, is opt-in, and runs solely against an explicit allow-list. It even reports passively observed writes from other systems as a security fact.
Gentle probing is the sensor's job. The production baseline is plan-only, the target planner is fail-closed, concurrency can be limited to a single host, and every protocol family is approved individually. The shipped lab profile must be replaced with the safe baseline before touching a real network.
Observations are stored locally first. If the configured Fleet Manager is temporarily unreachable, sensor continues collecting within the approved scope and sends pending changes after the connection returns. sensor initiates the mTLS connection. Passing sensor data to inventory requires a configured integration.
Observations can reveal hosts, users, services, certificates, and communication paths, so they are treated as sensitive. Normalization is data-minimizing: usernames, principals, and secrets are hashed rather than stored, raw DNS and OTOT covers hardware and software that monitor and control physical devices, plants, processes, or infrastructure. payloads are dropped, and raw evidence is off by default. The local diagnostics view is read-only and reachable only over loopback.
Together we clarify which sources can be used with low risk and which observations matter first for inventory, operations, and security.